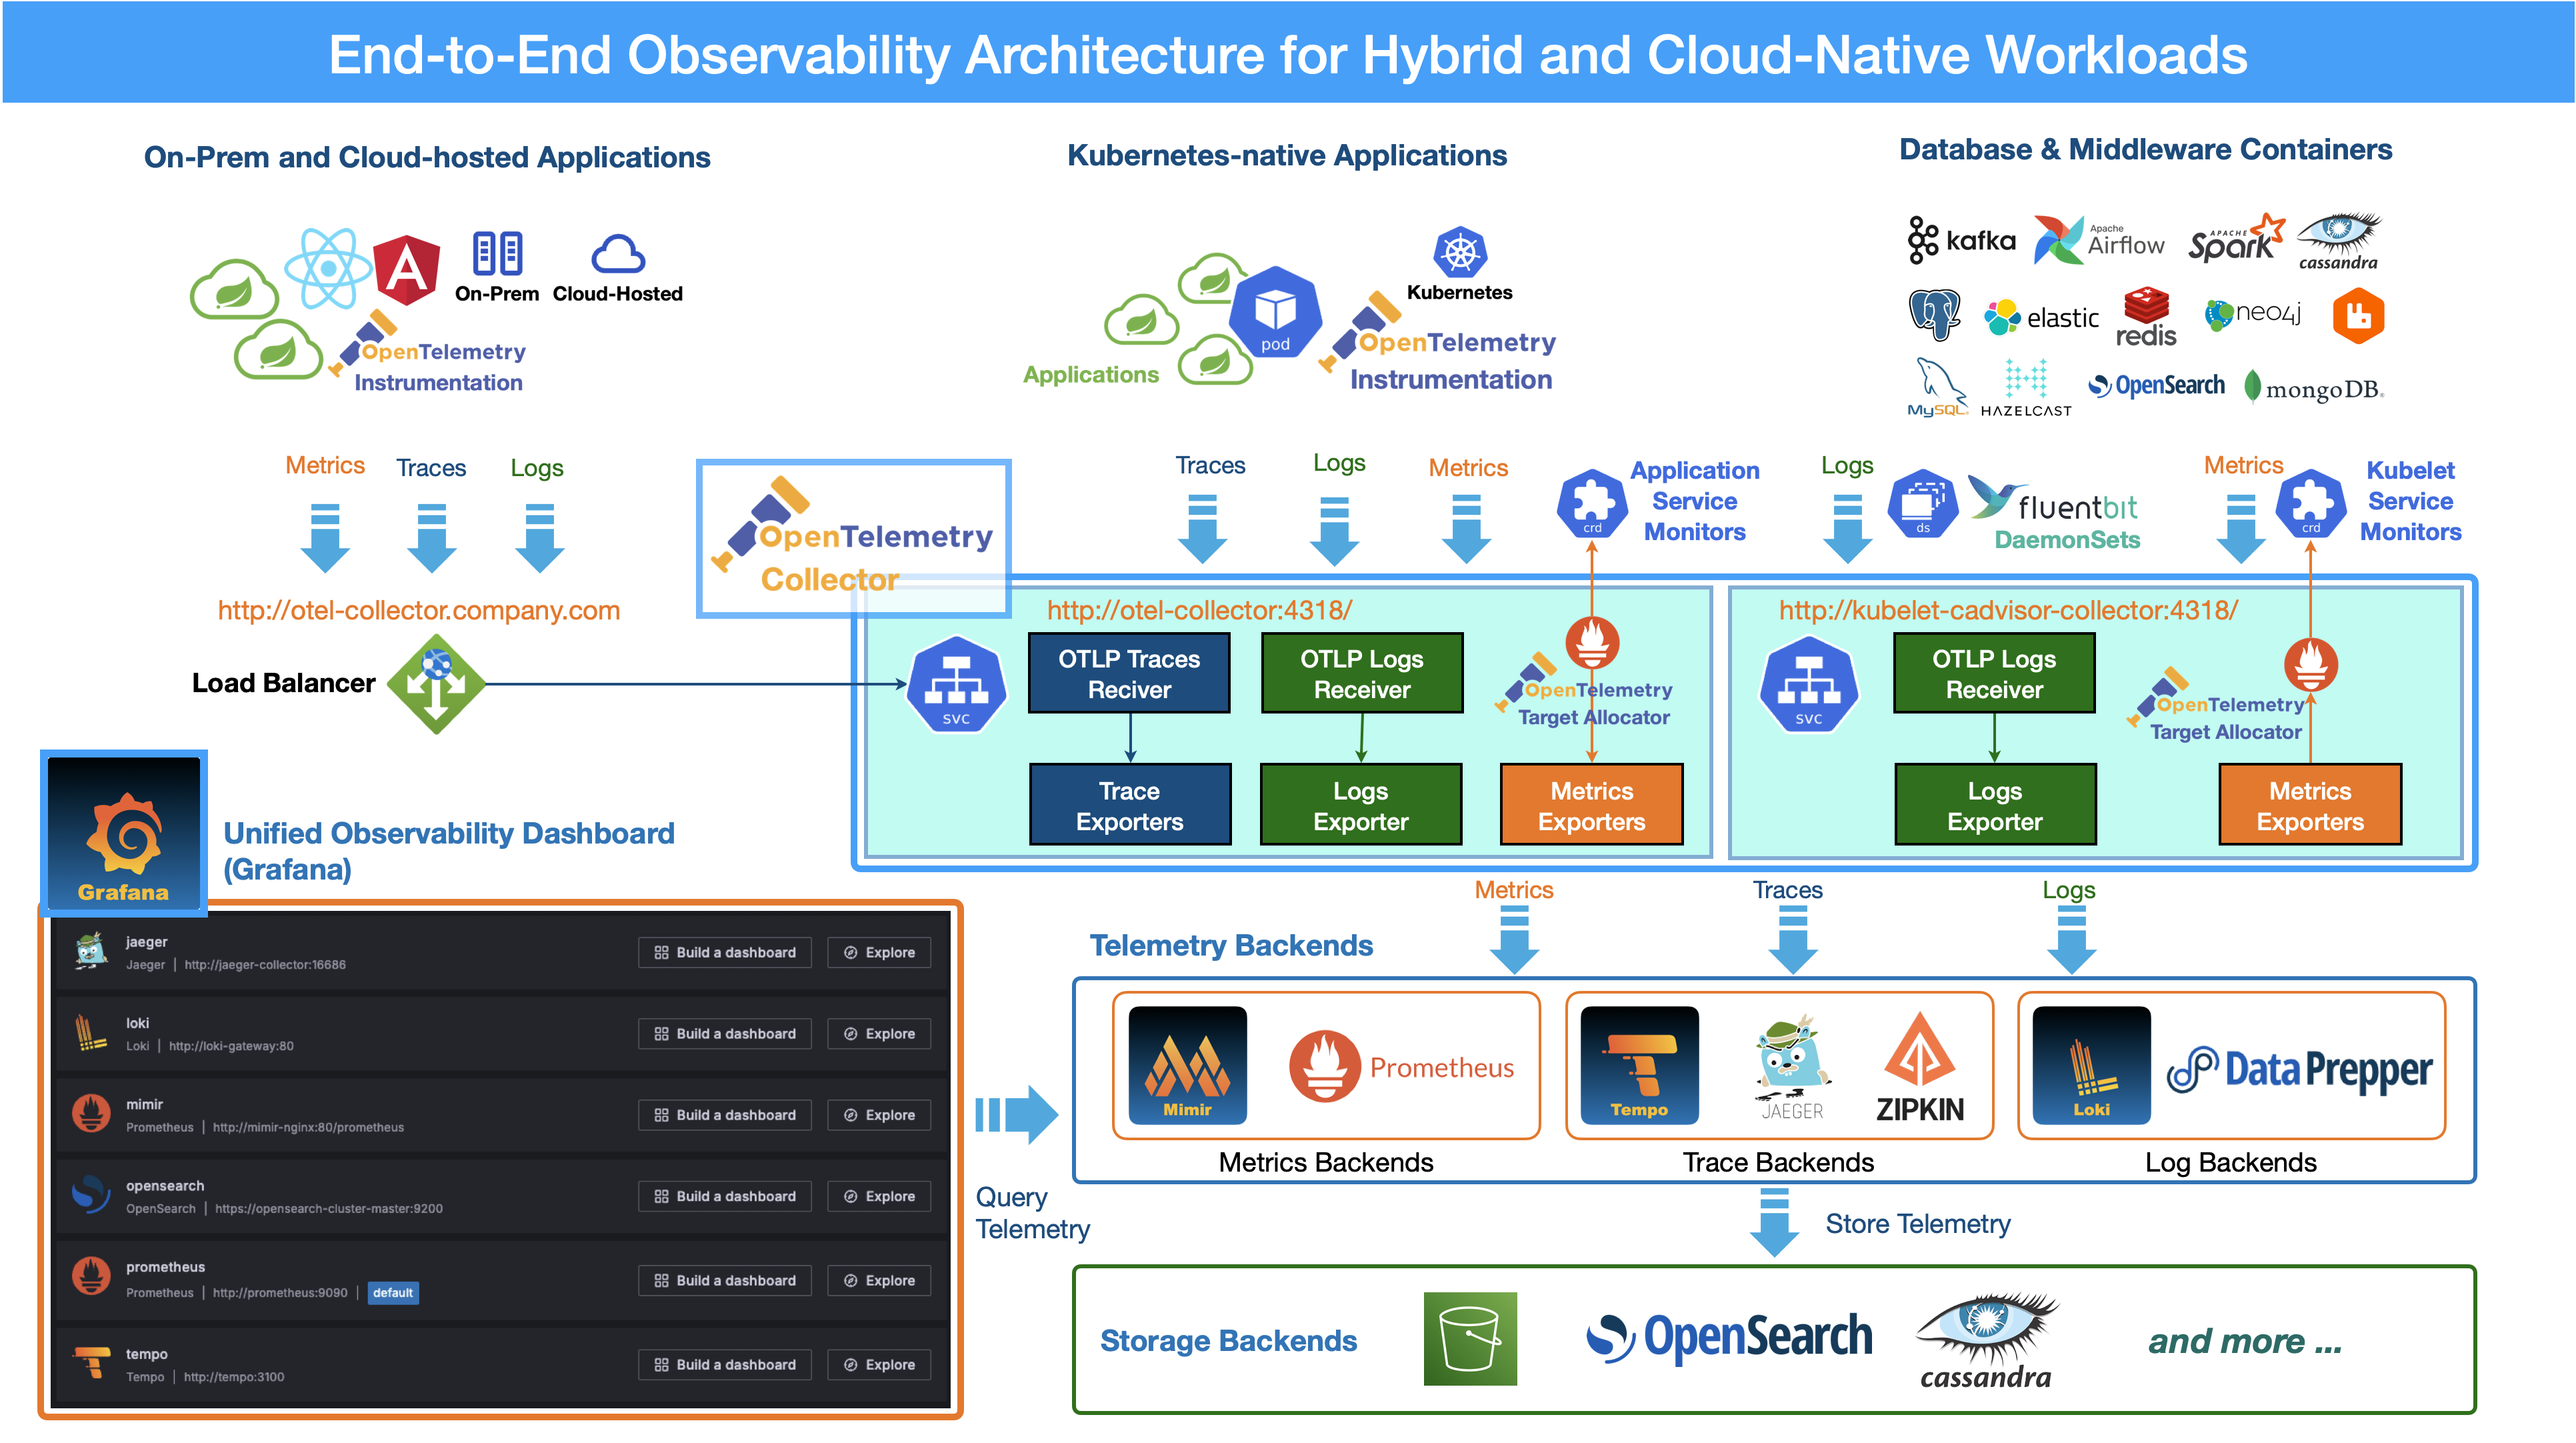
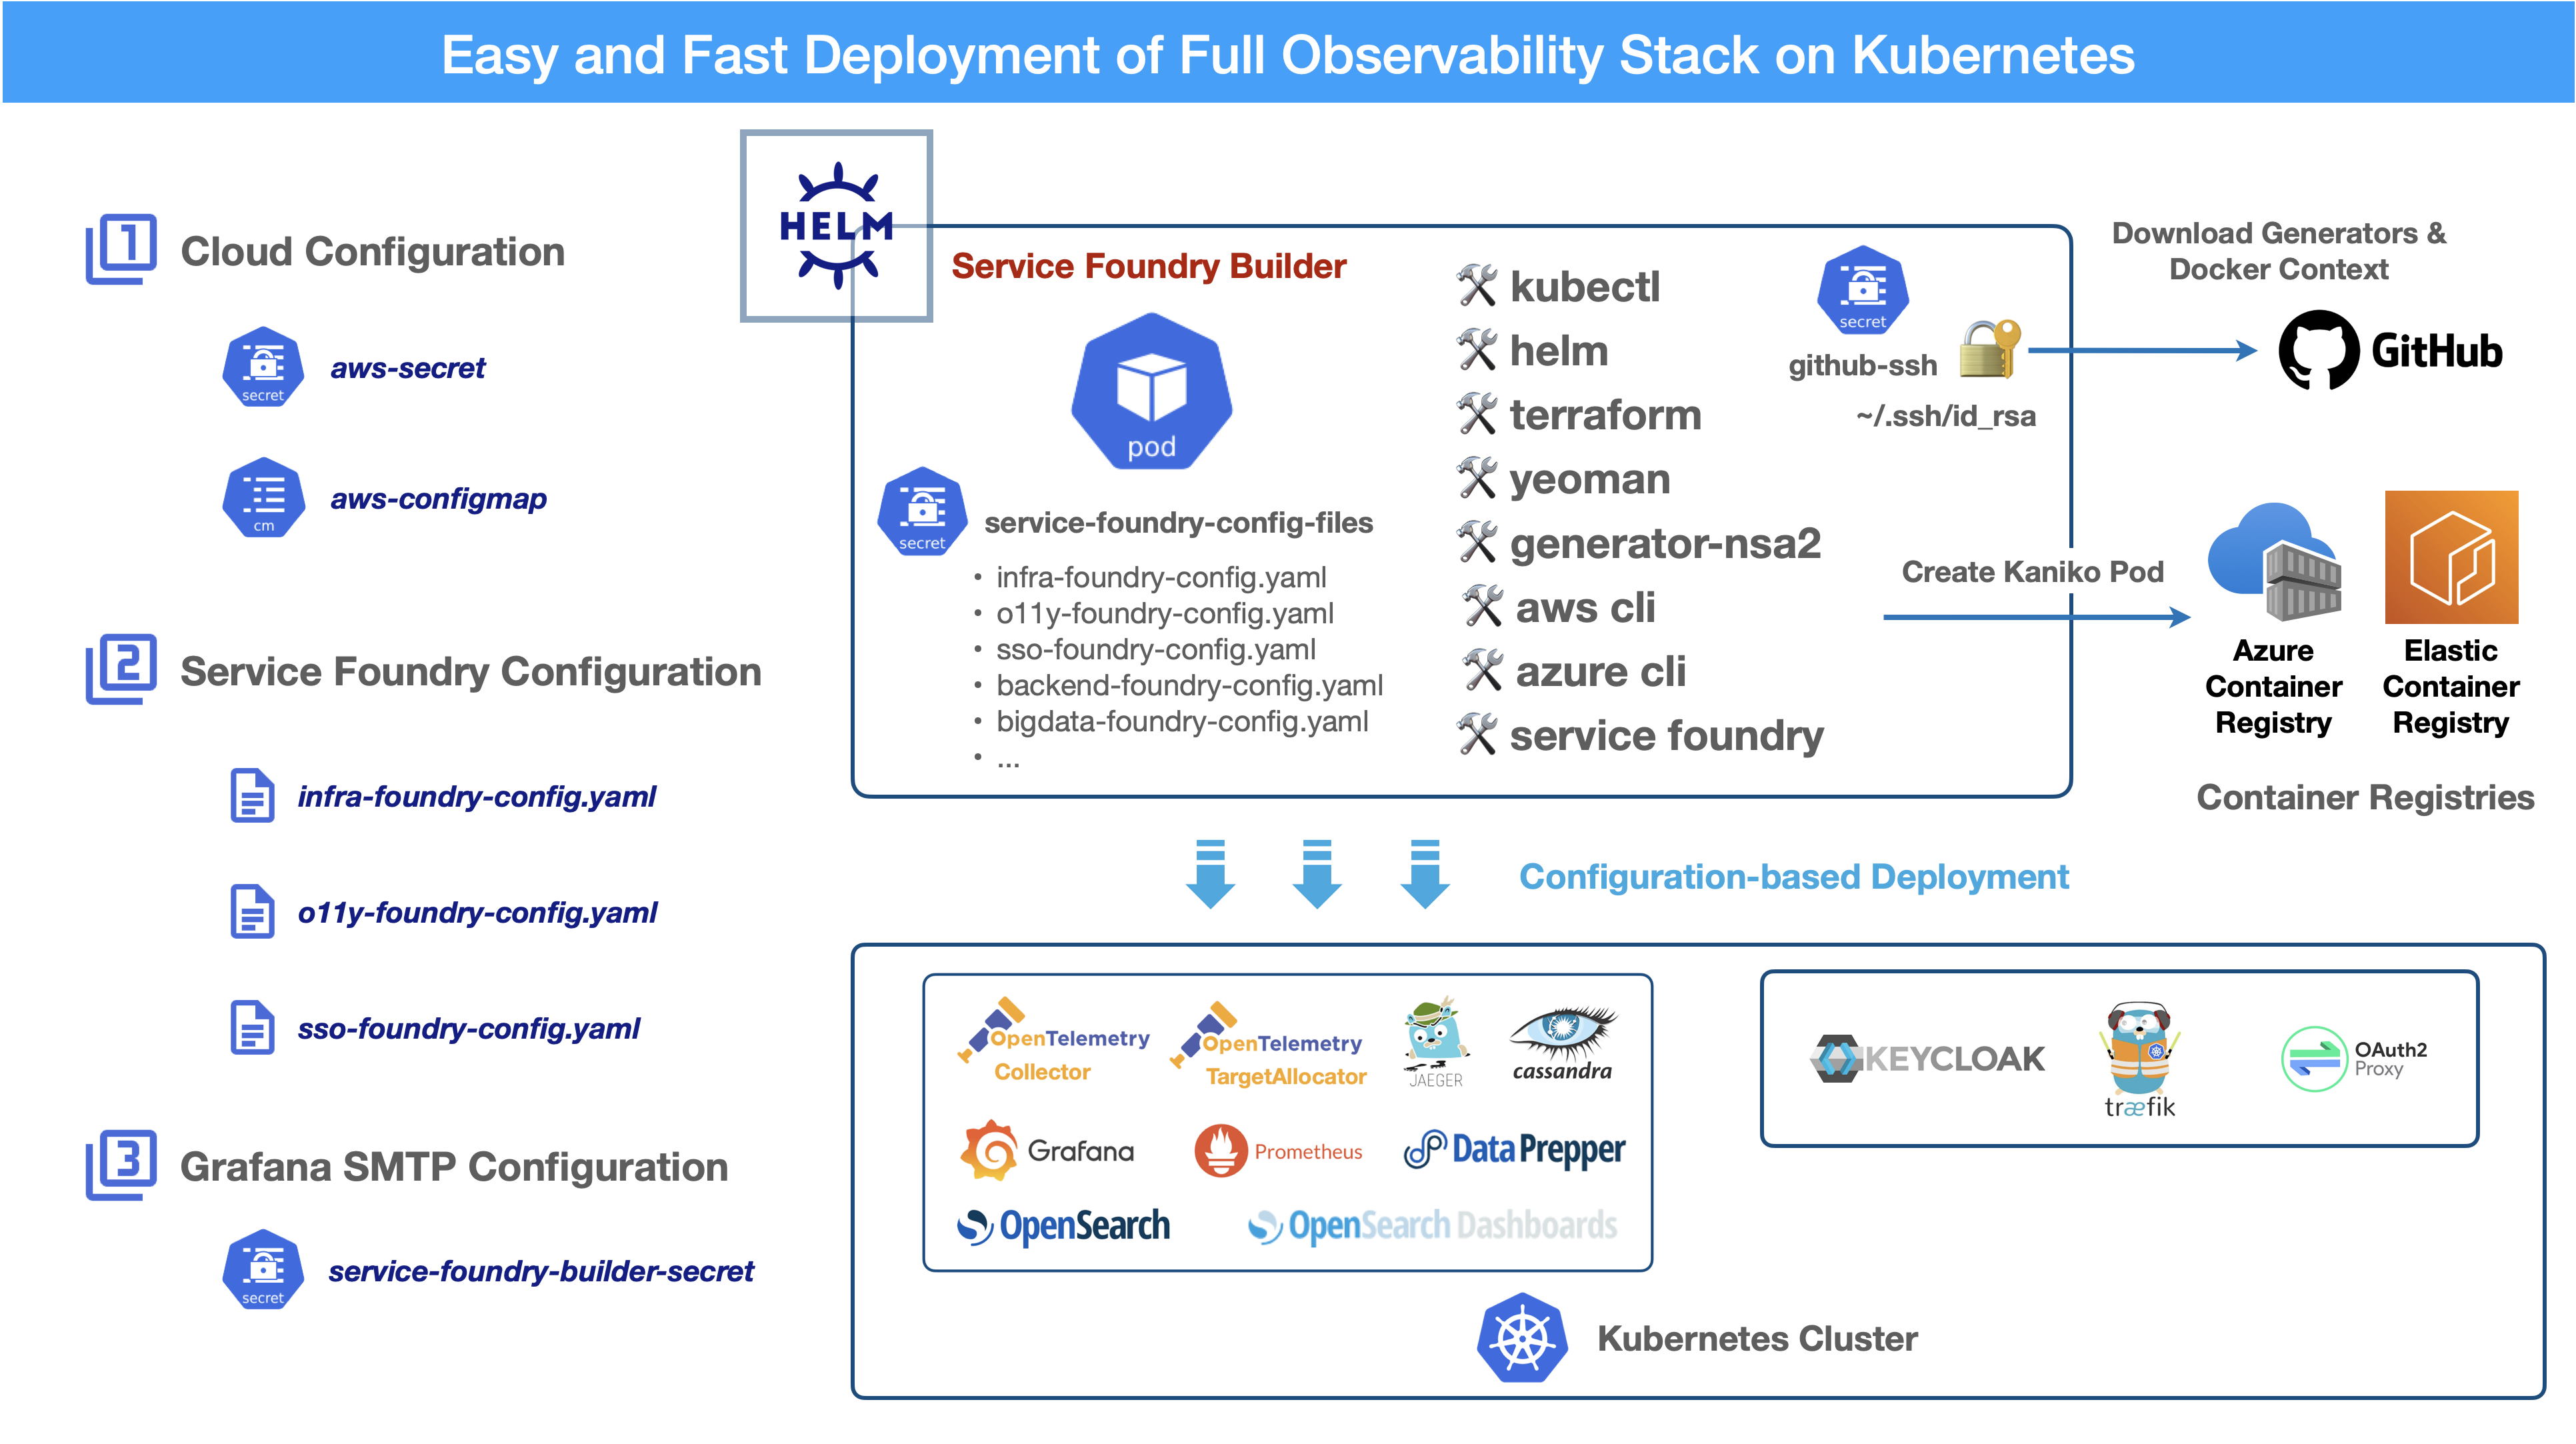
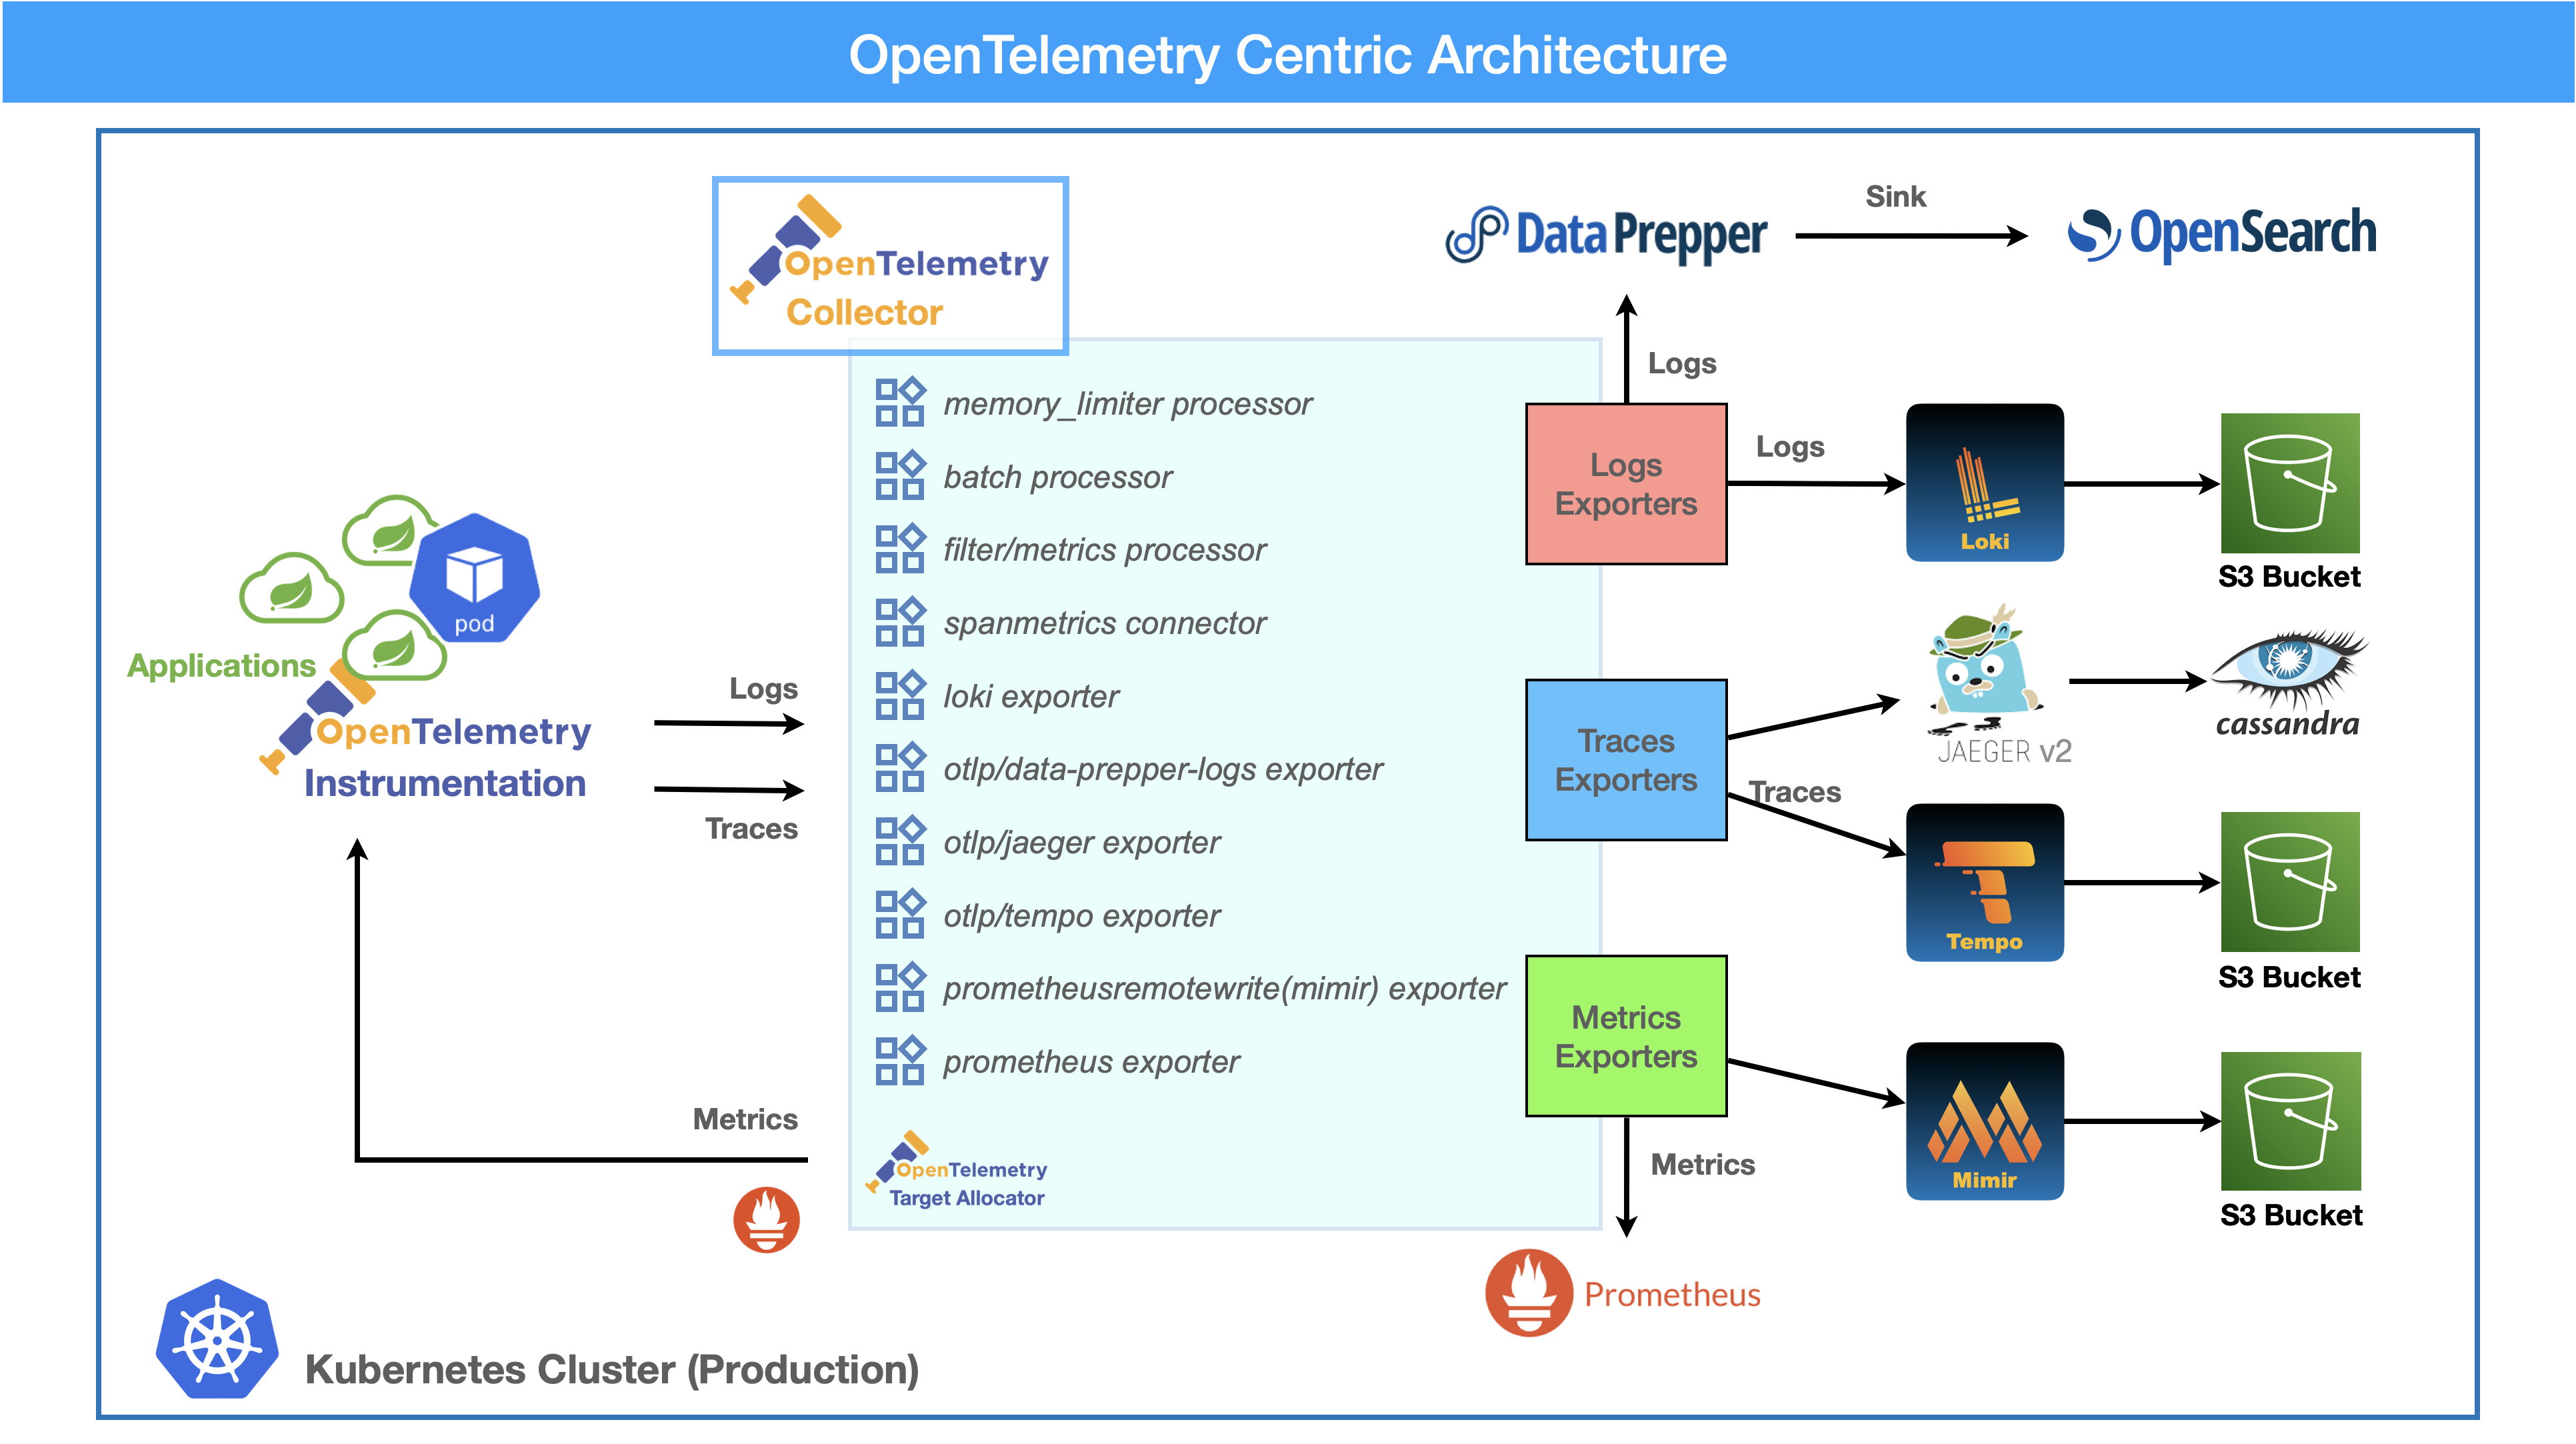
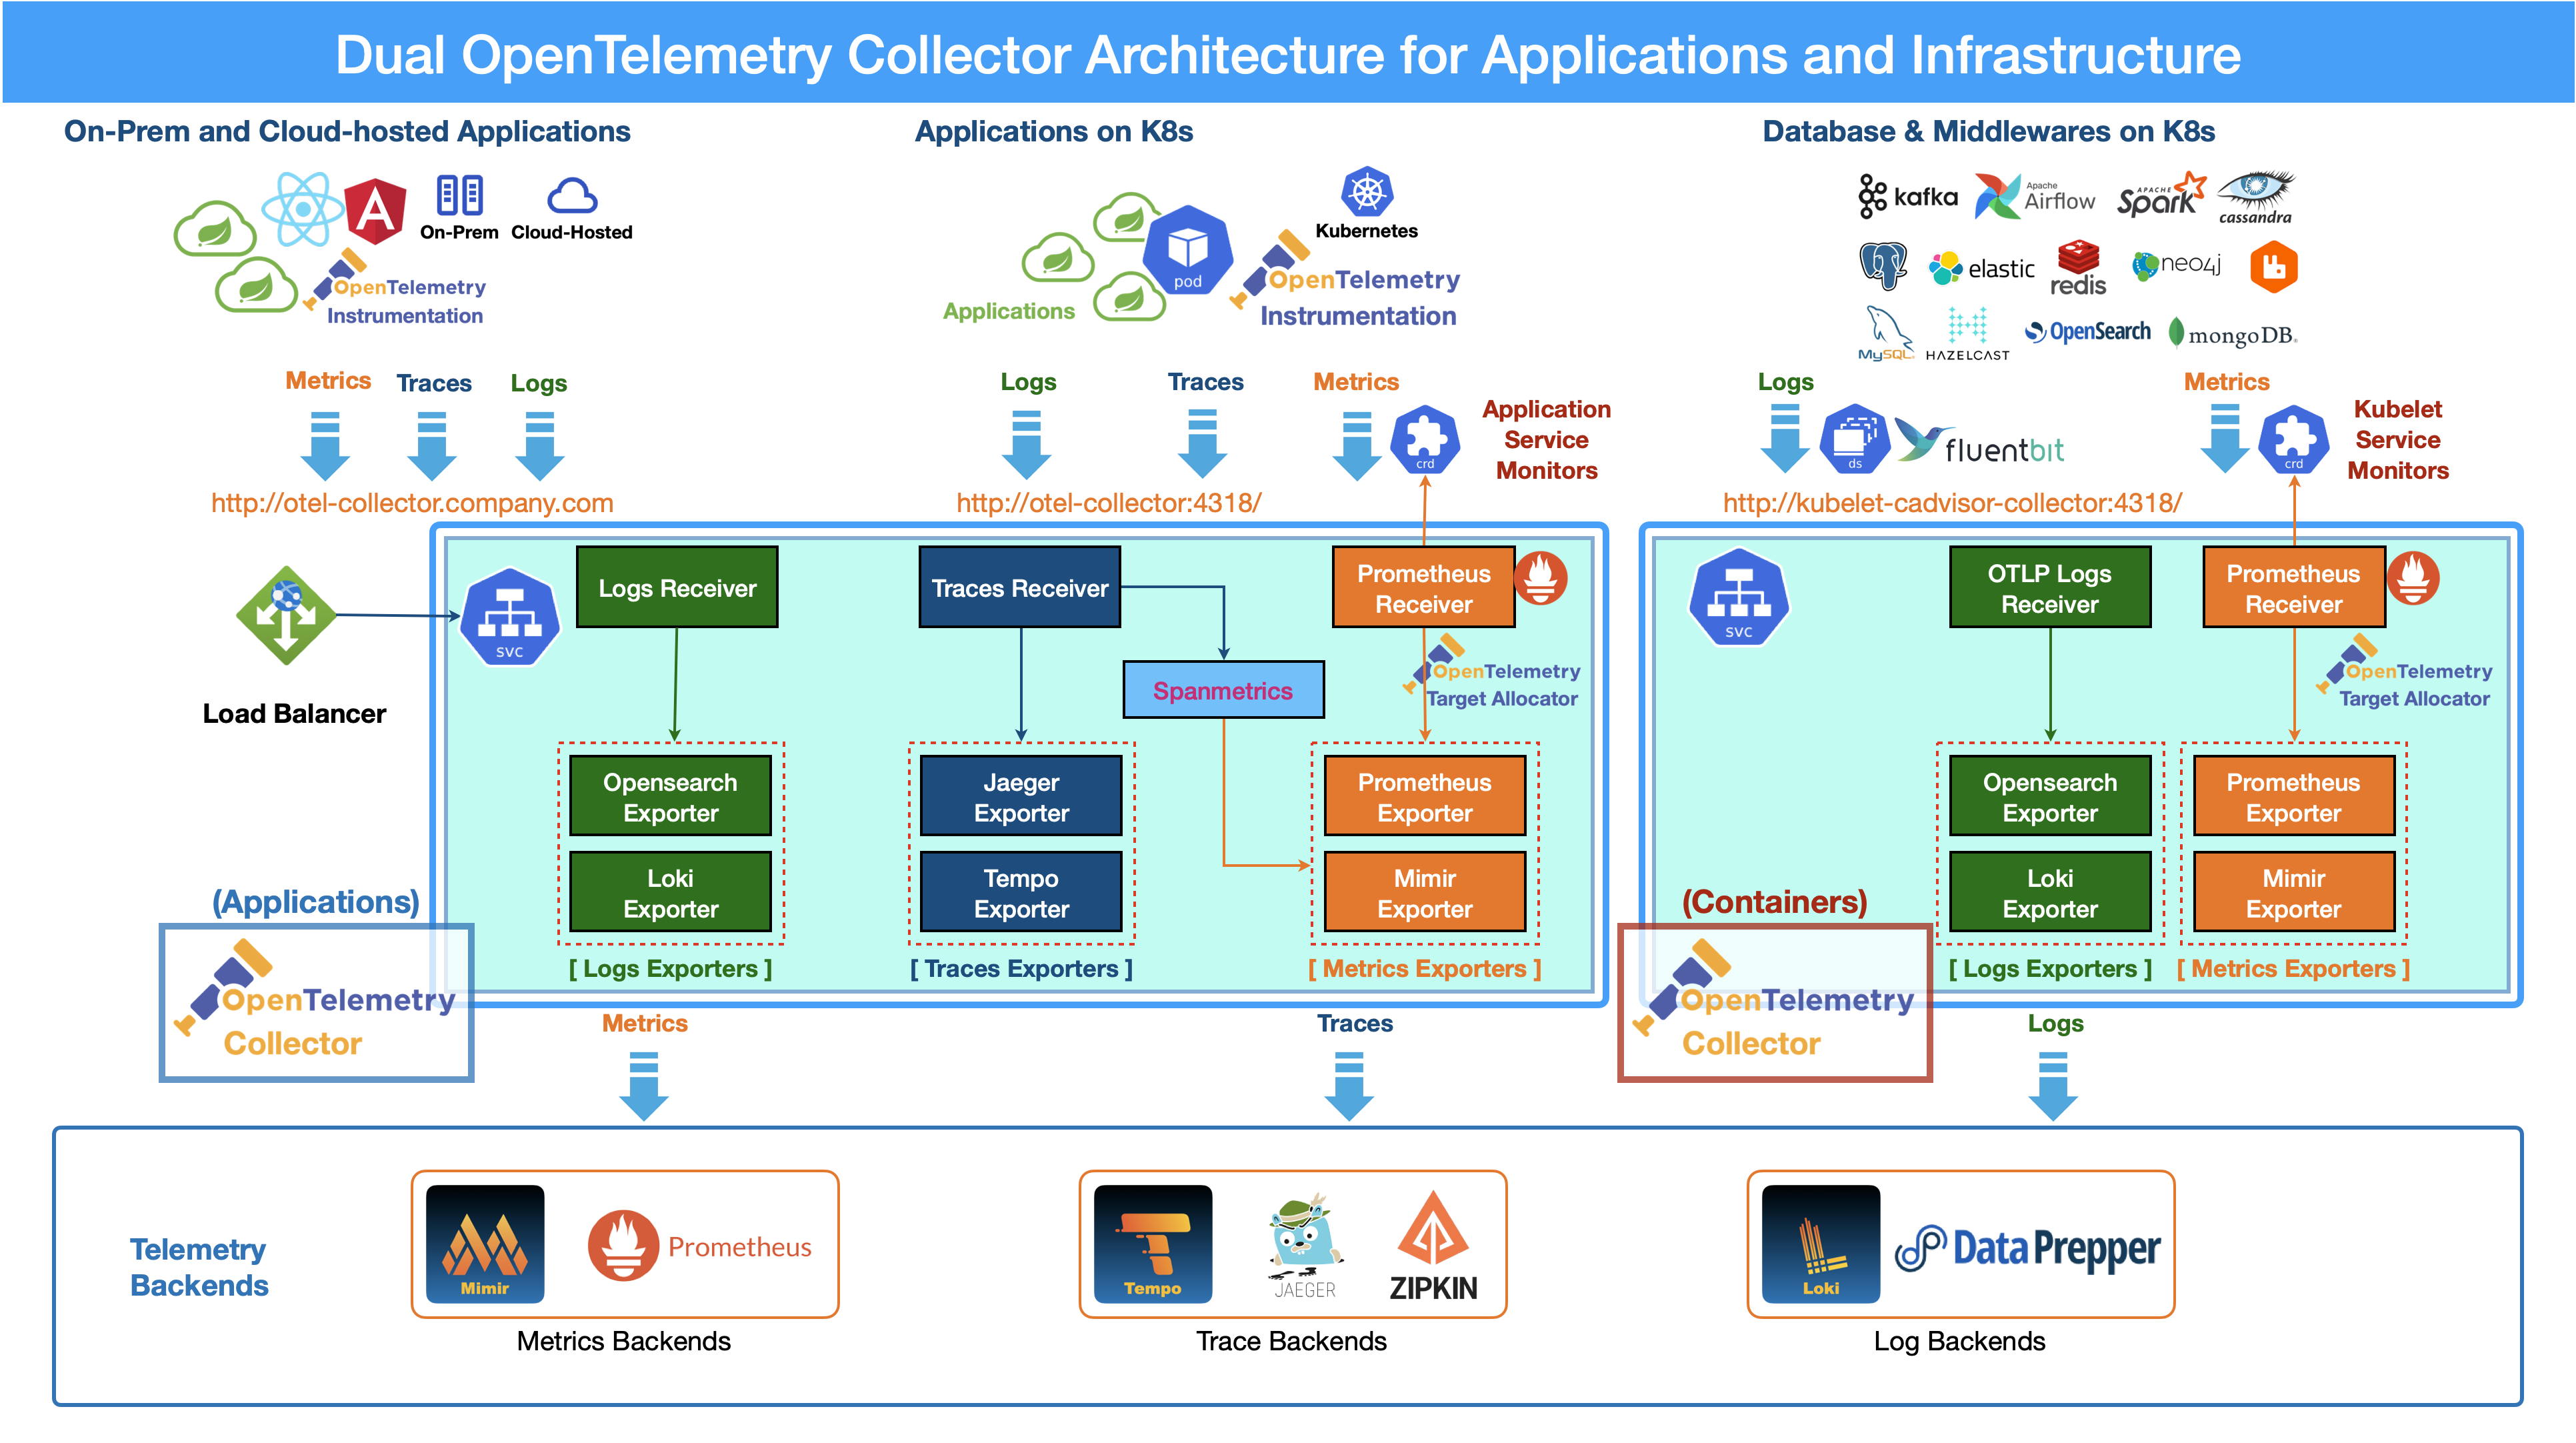
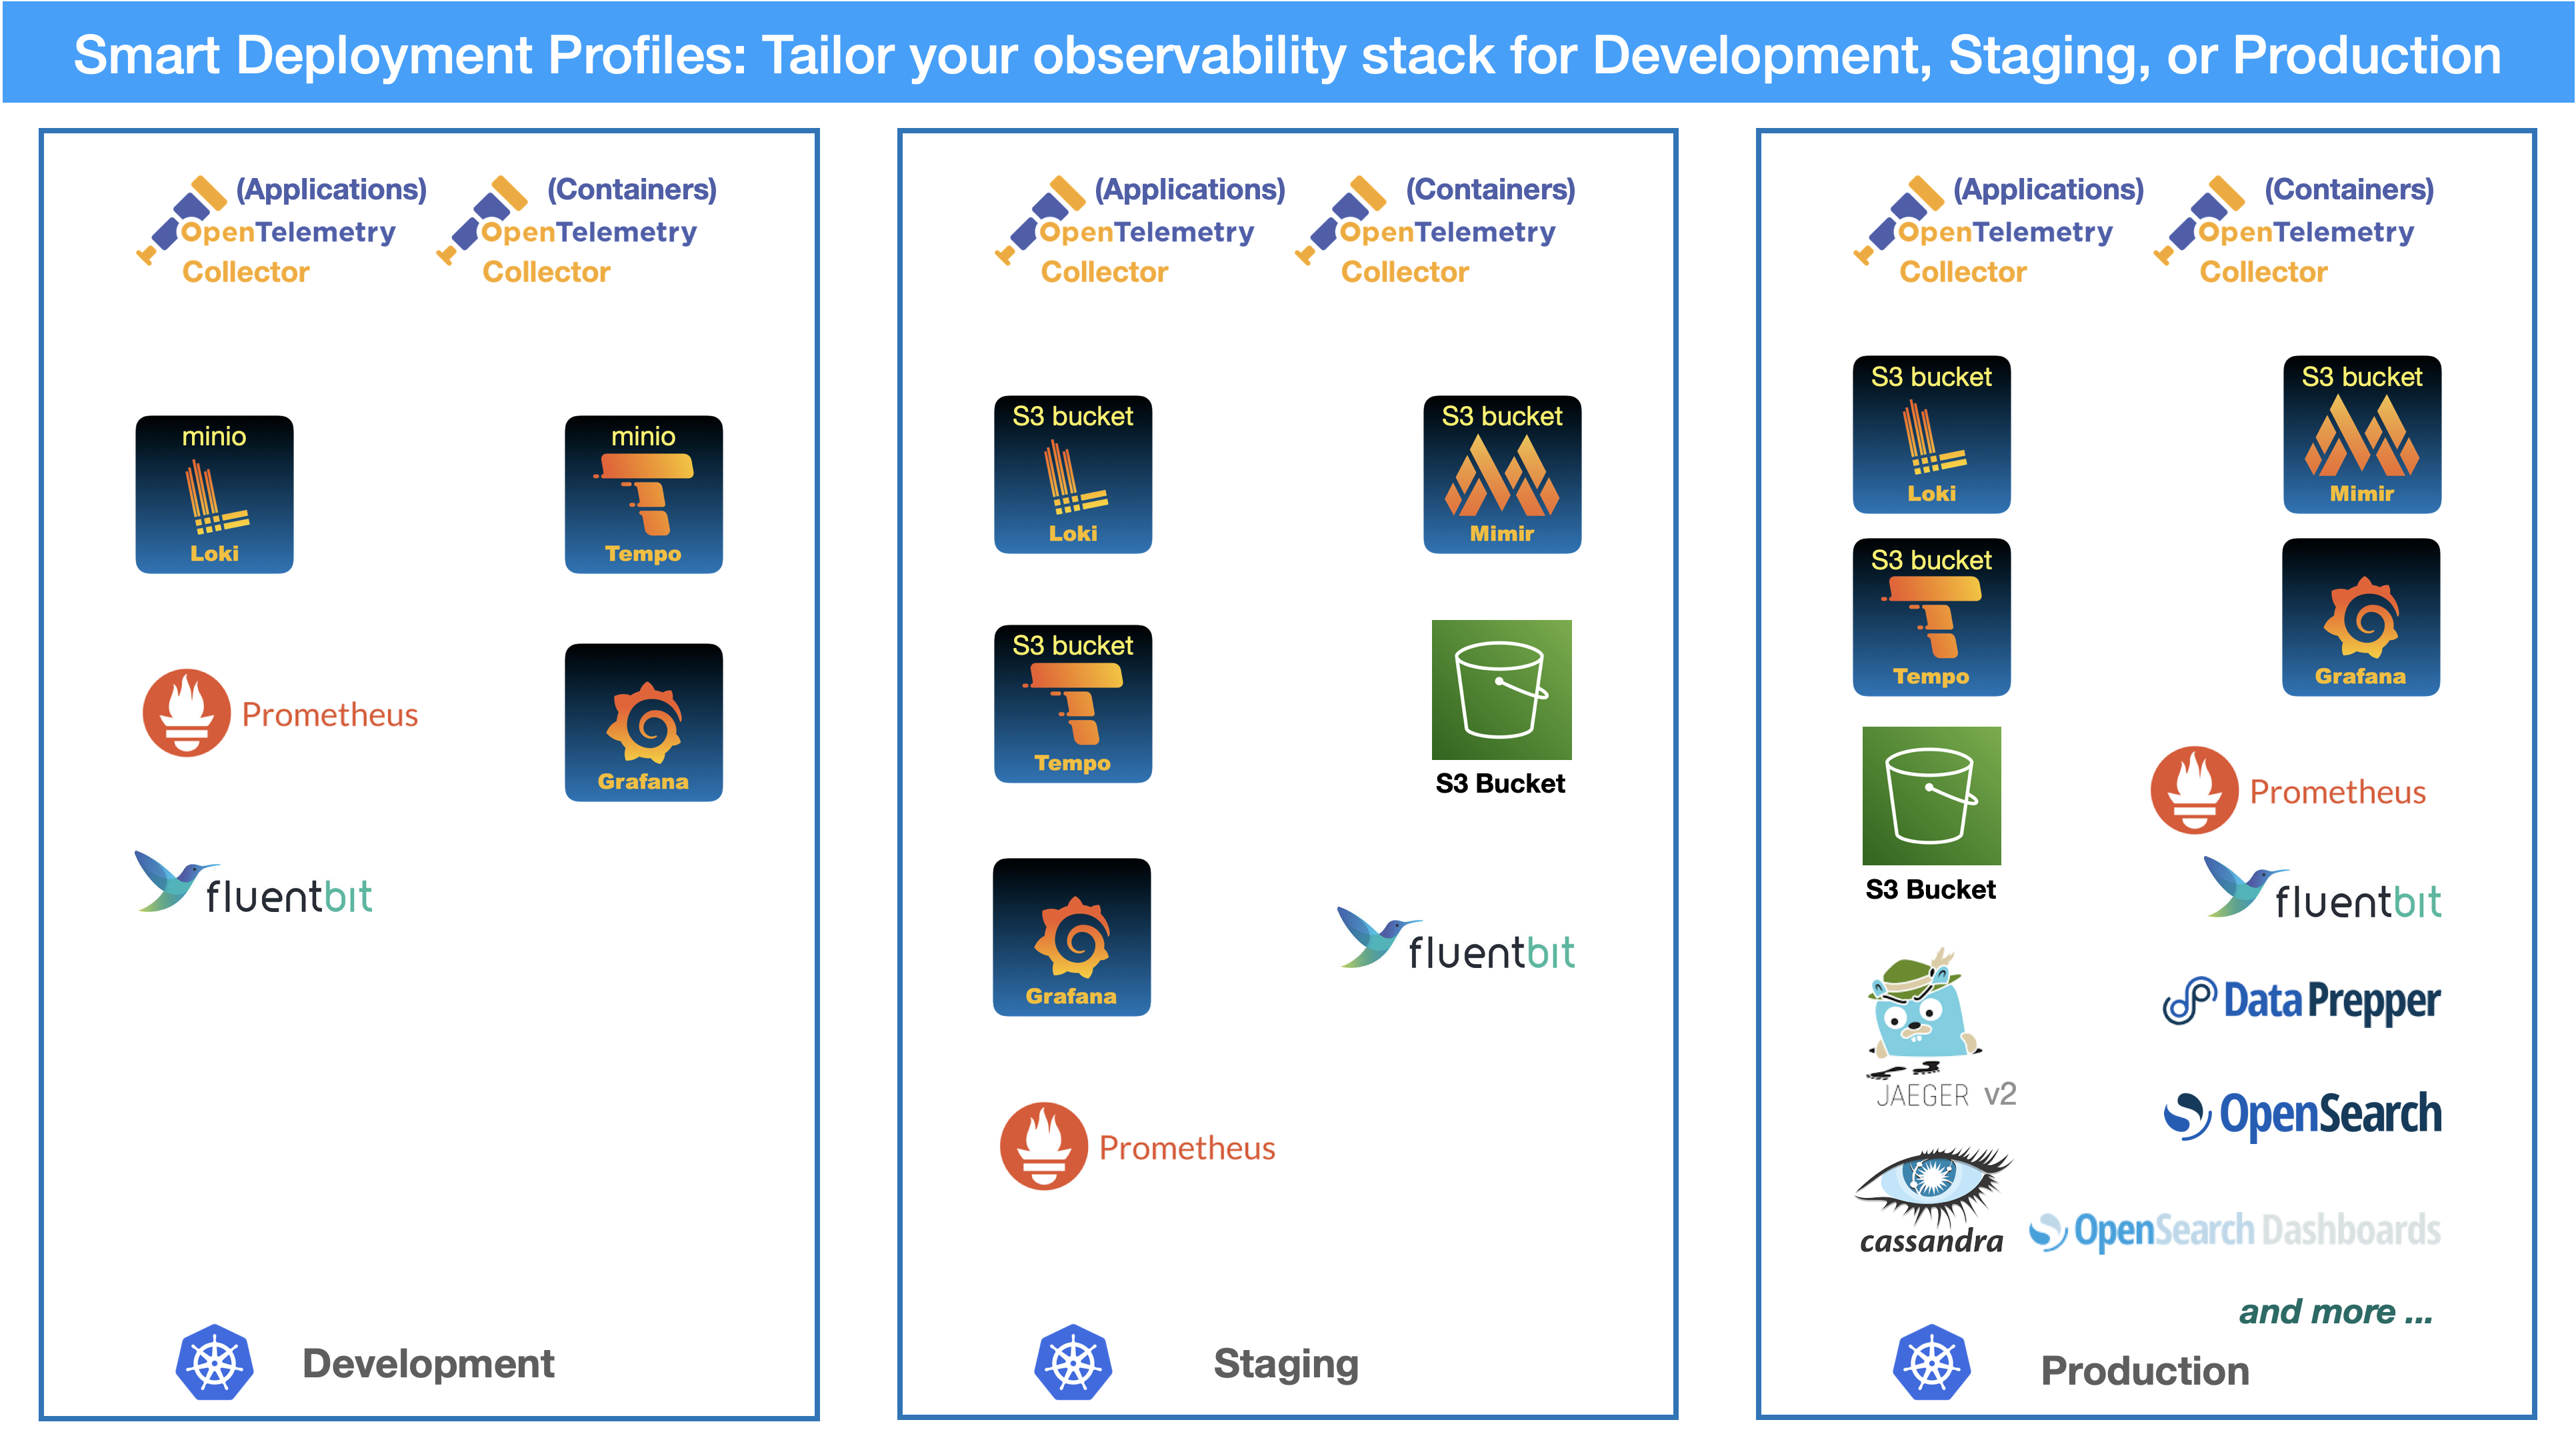
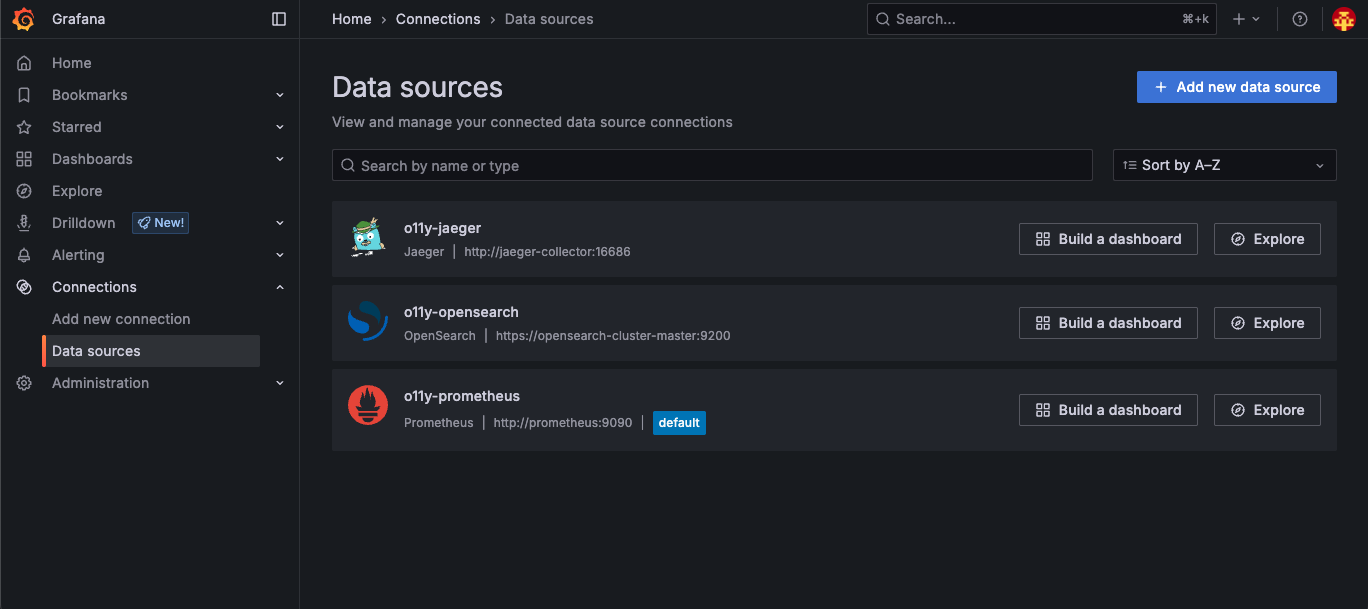
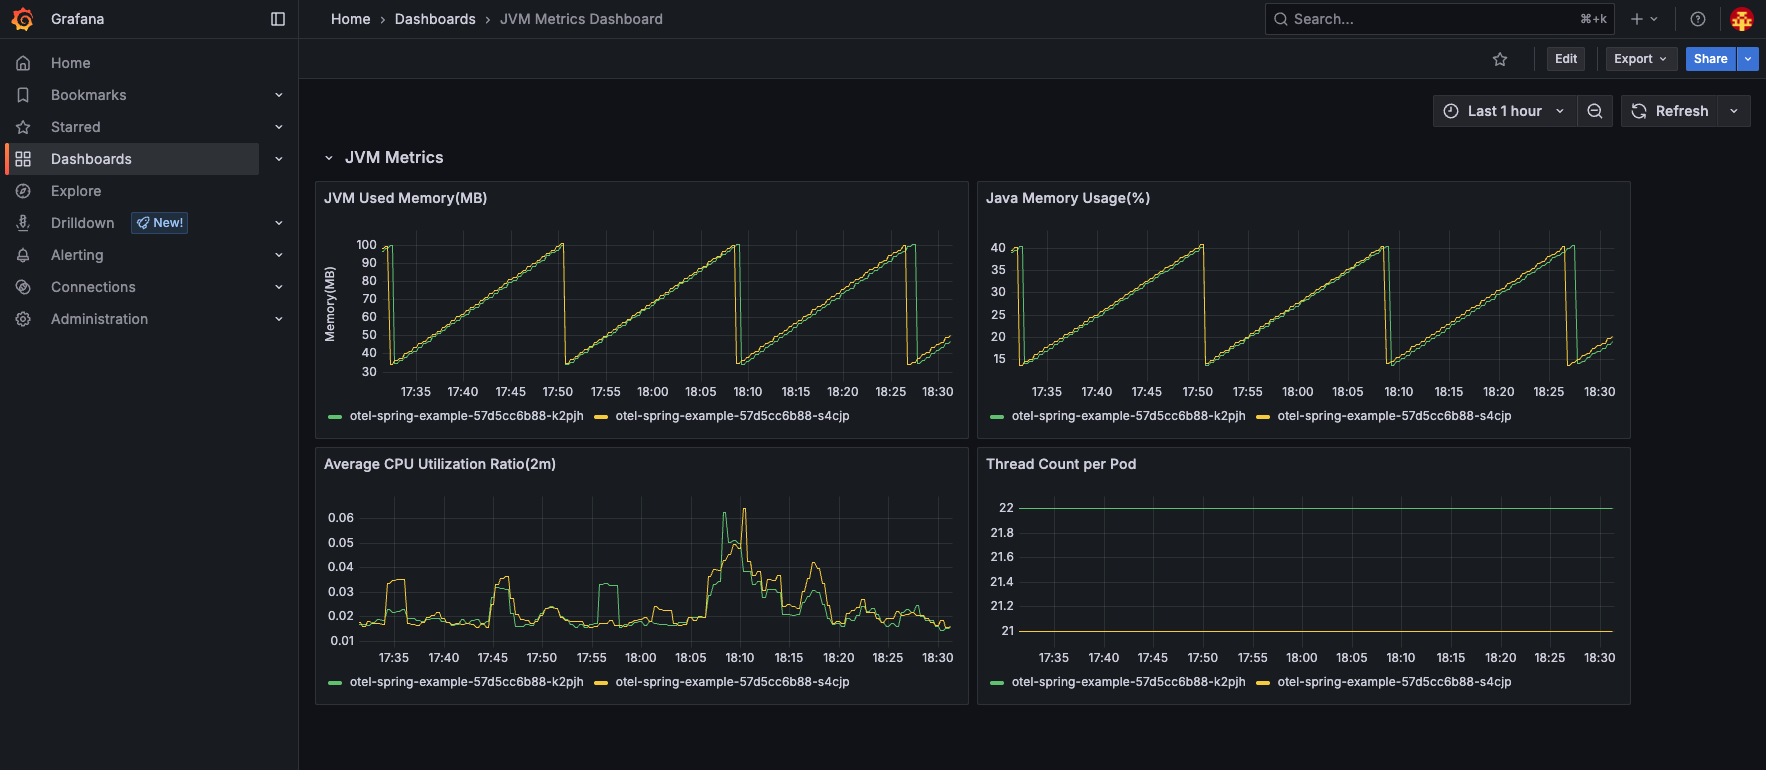
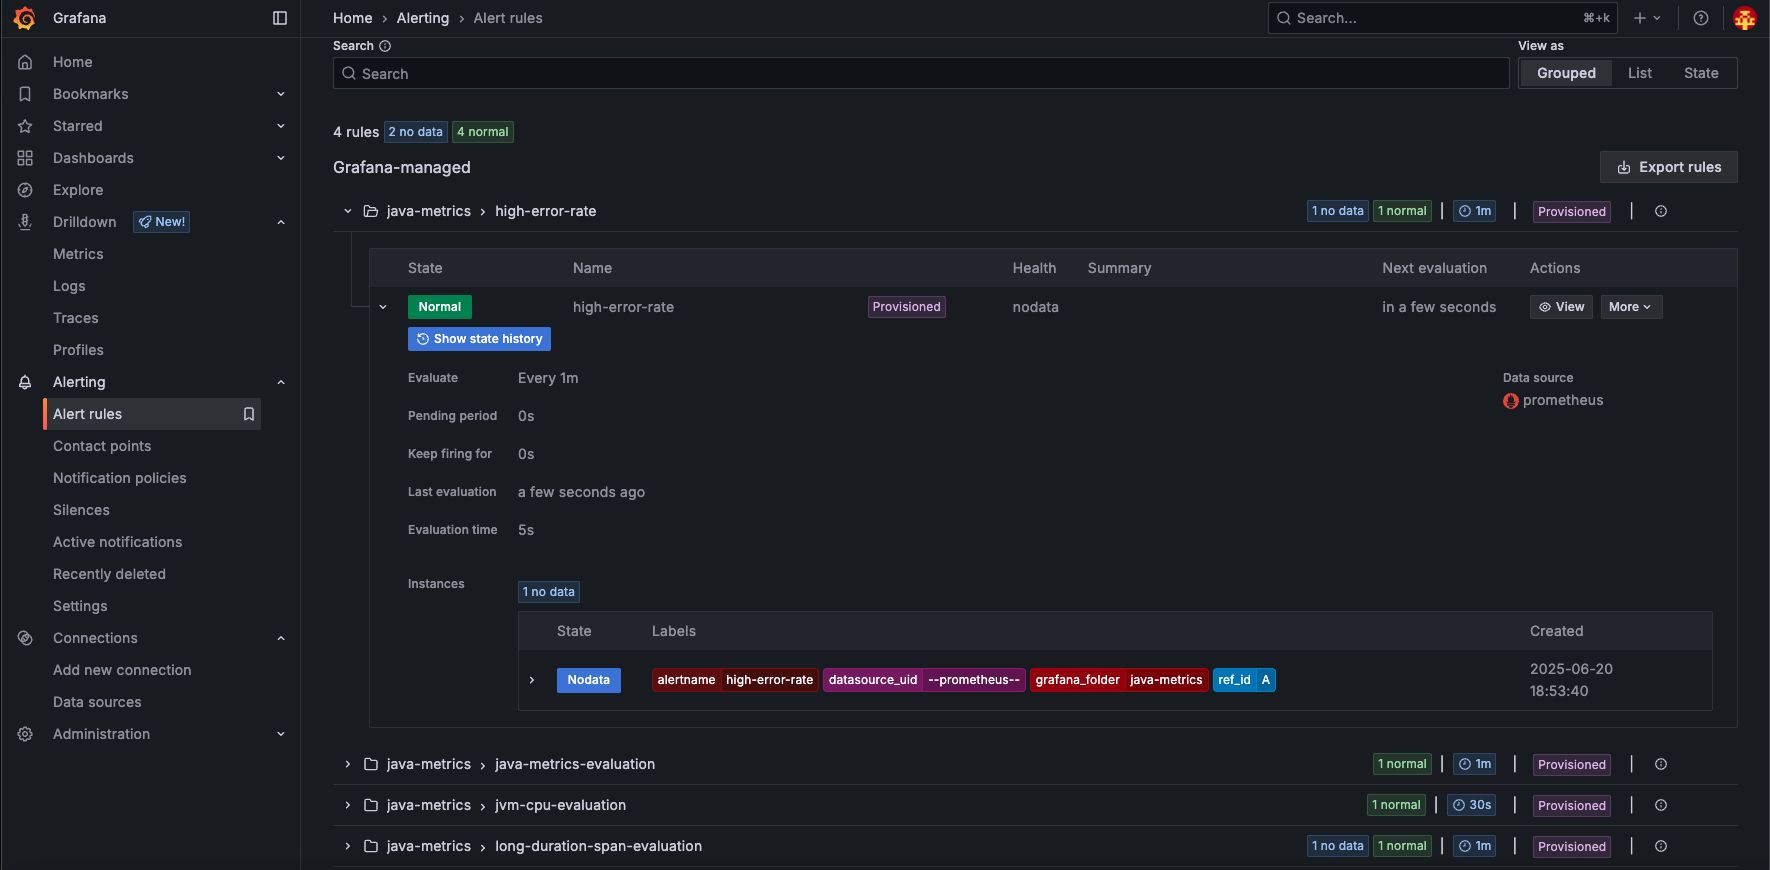
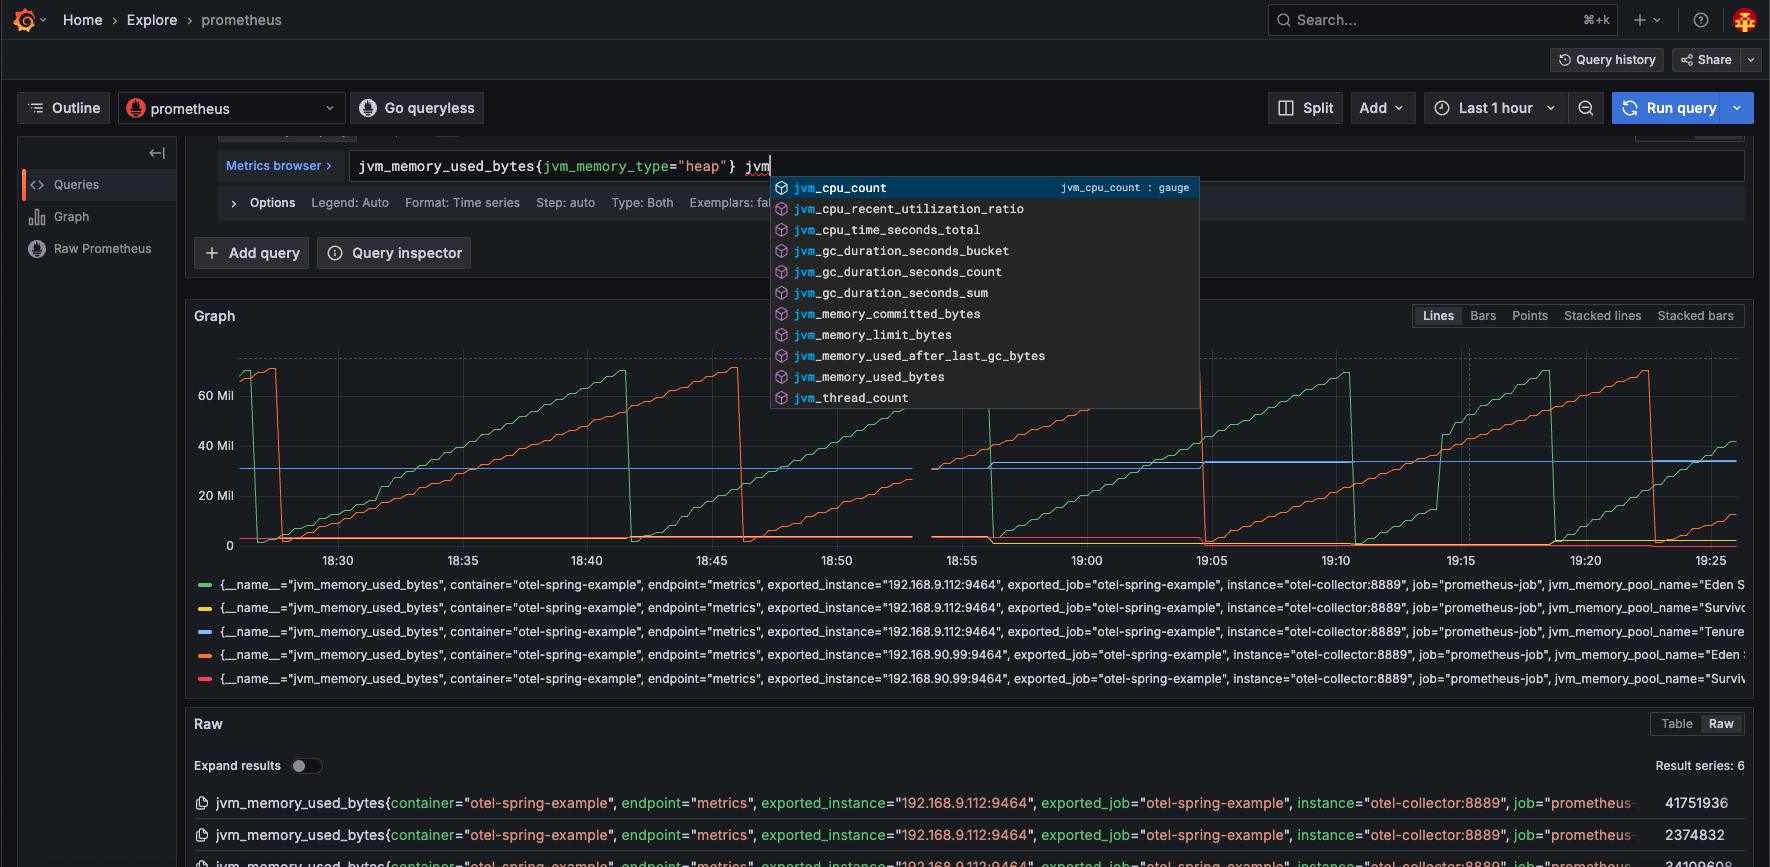
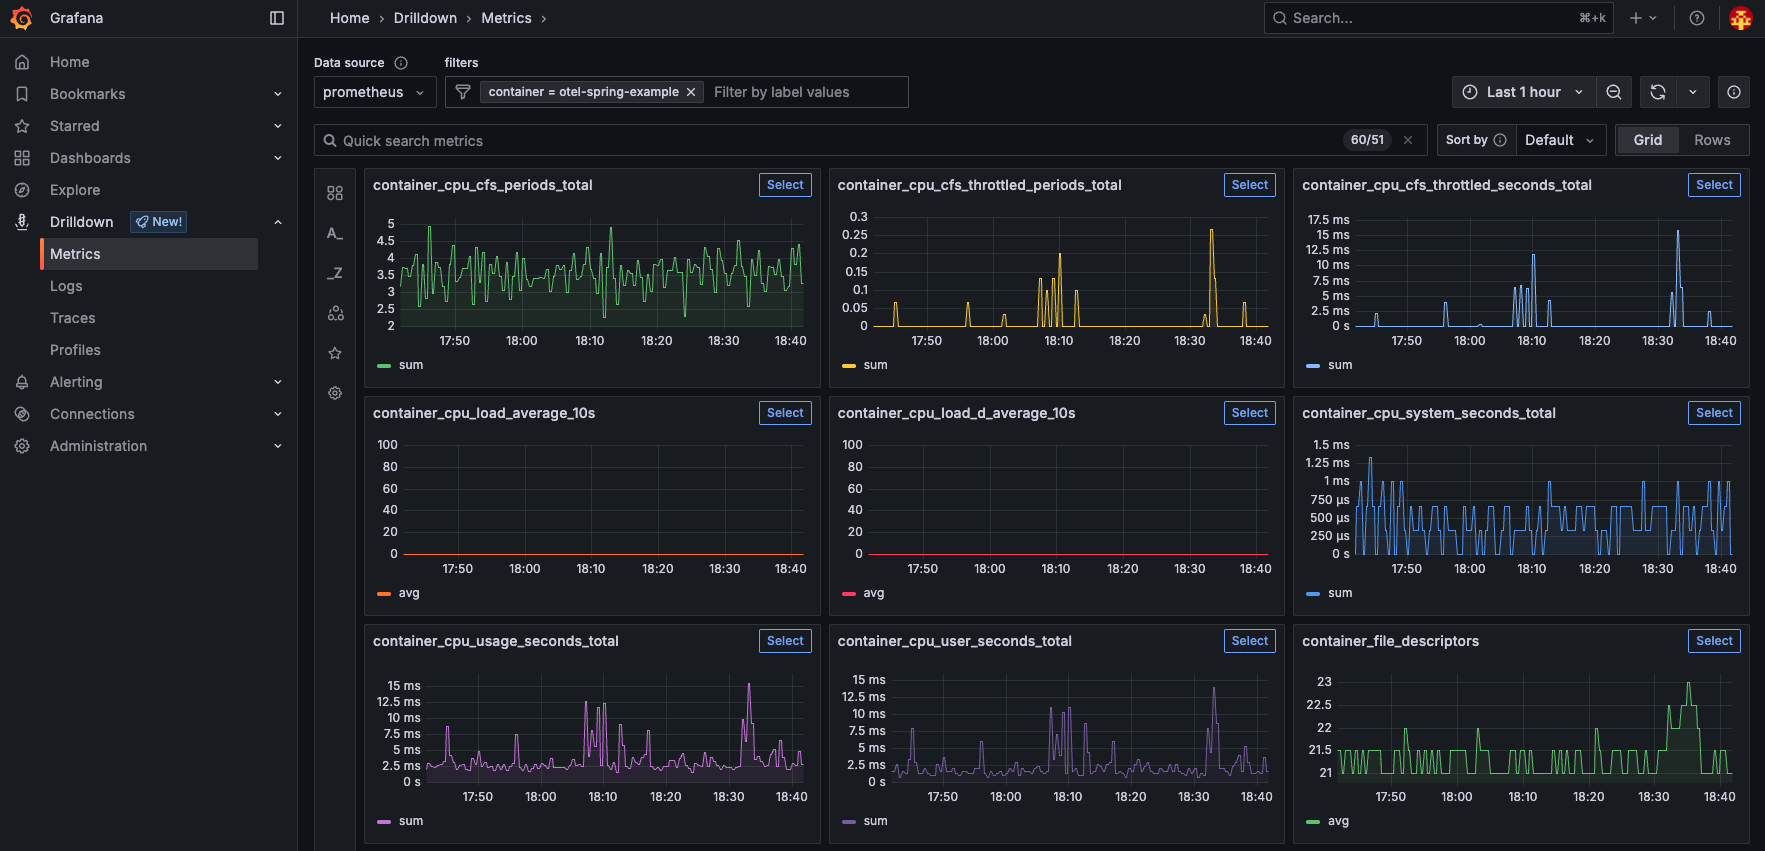
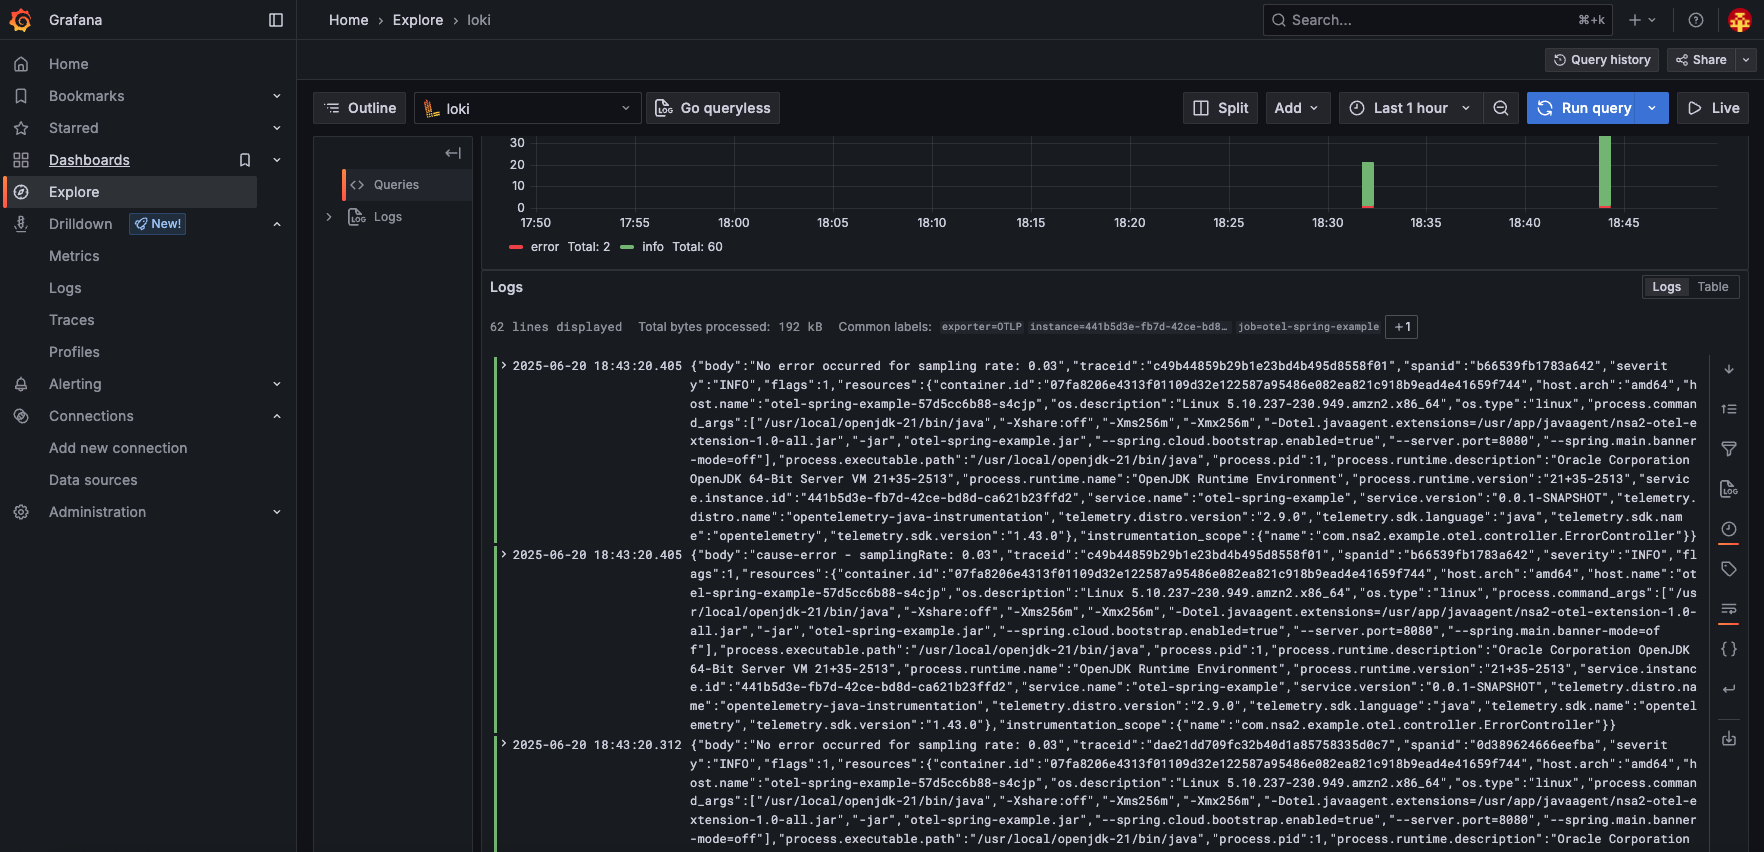
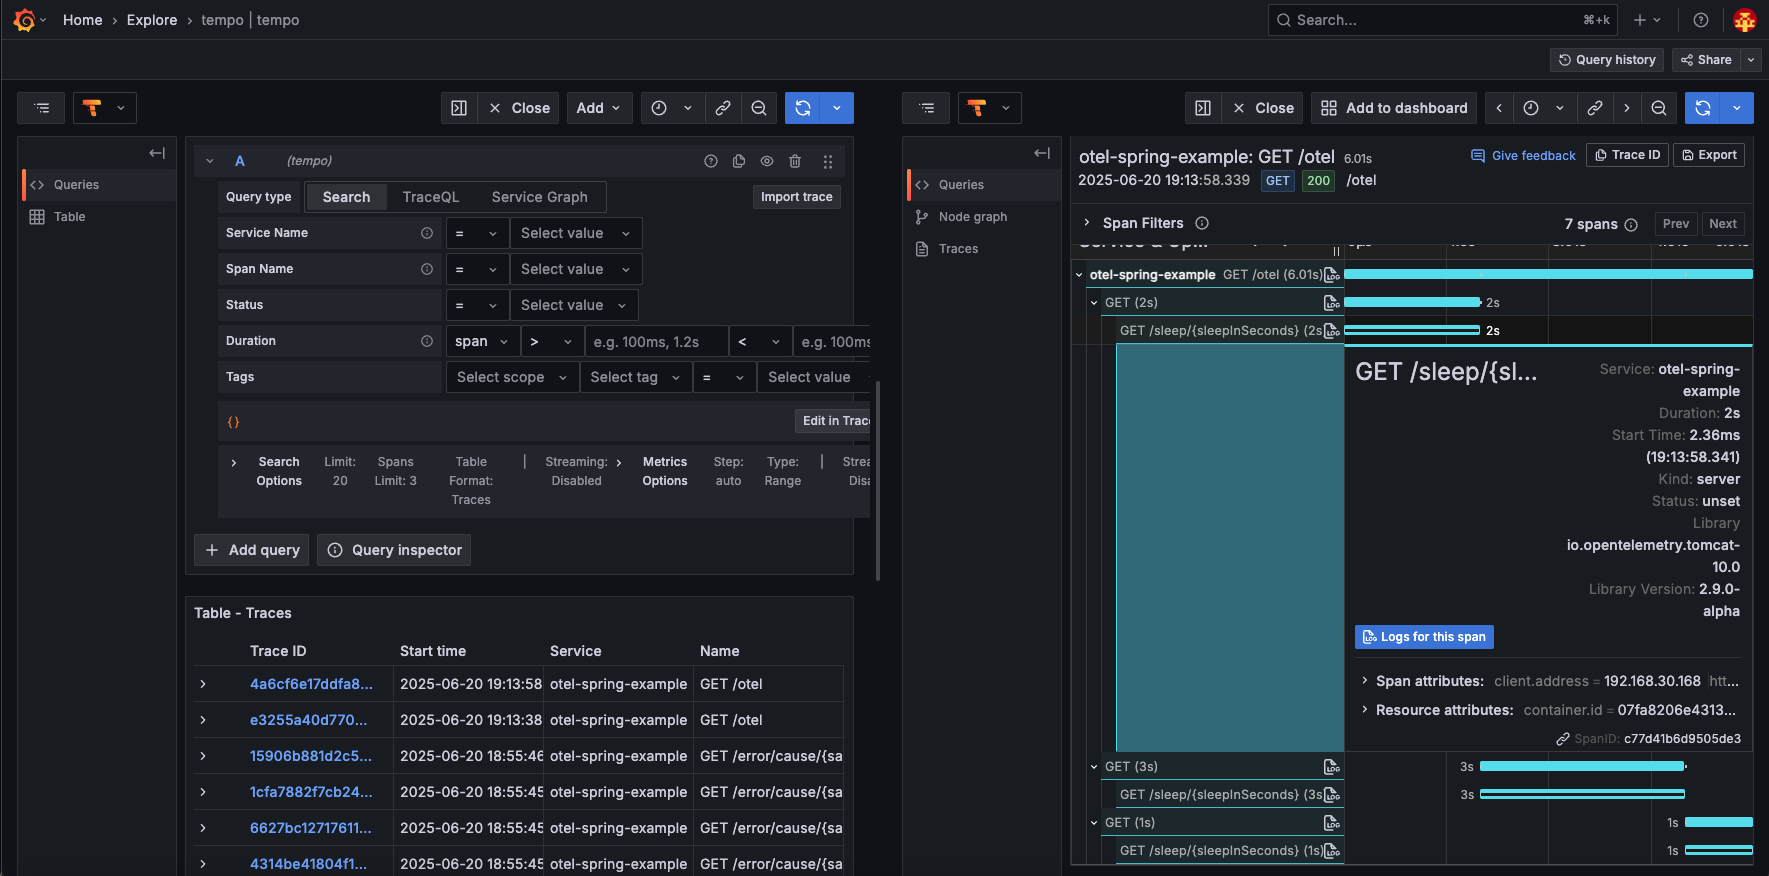
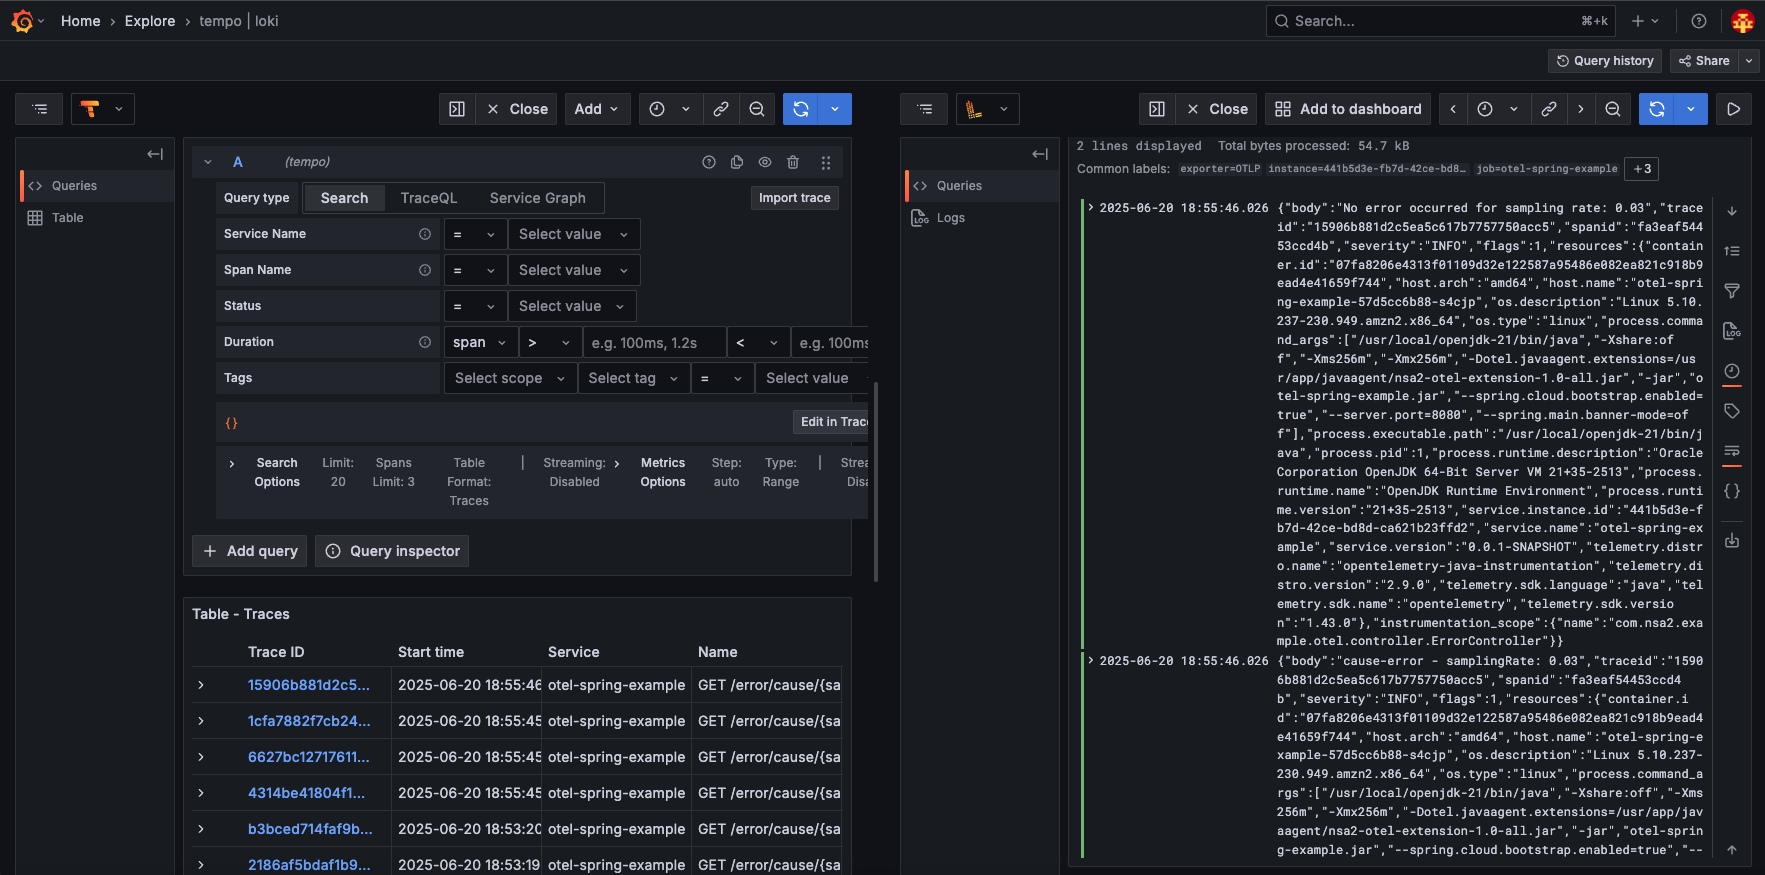
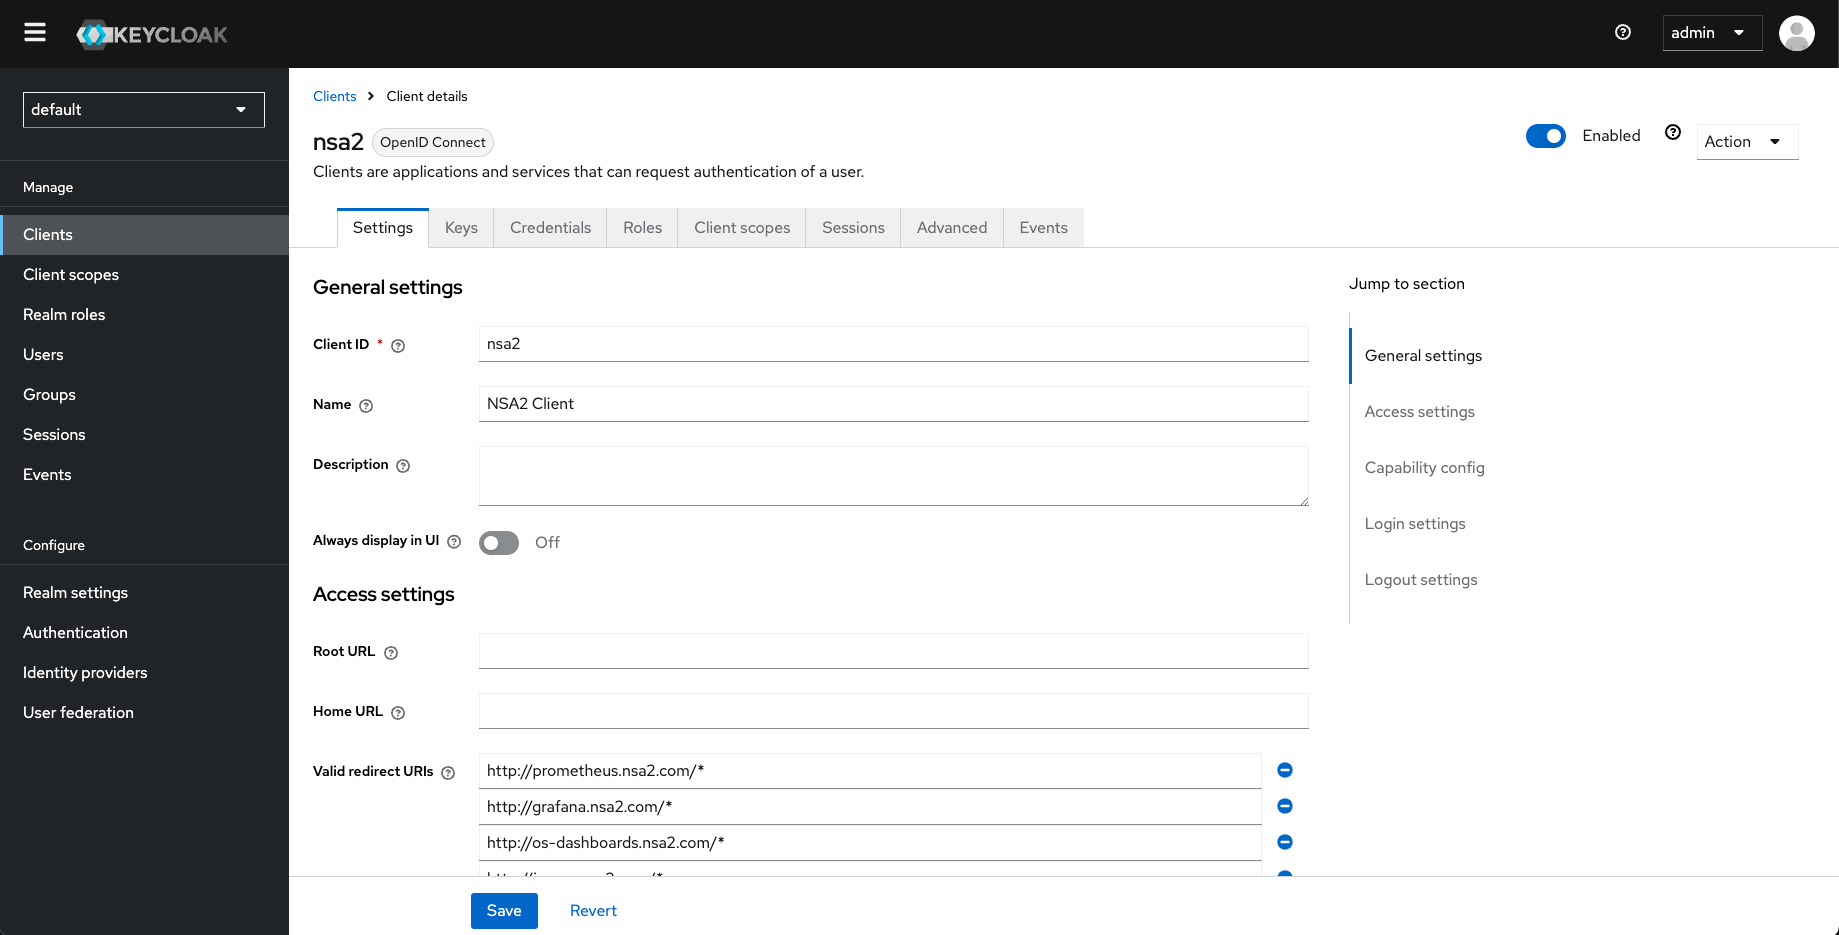
The Observability Foundry provides a comprehensive suite of tools for monitoring and logging in Kubernetes environments. It includes Prometheus for metrics collection, Grafana for visualization, and OpenSearch for log management, all integrated with SSO capabilities.
Accelerate development with pre-configured observability tools. Spin up a production-grade observability platform on your Kubernetes cluster in under 5 minutes using a Helm-based installation.
Collect and correlate logs, traces, and metrics from all components of your system, including frontend, backend, and containerized workloads.
Built on the OpenTelemetry standard, all telemetry data is collected using a vendor-neutral, industry-standard protocol for maximum compatibility and future-proofing.
Application instrumentation is performed using OpenTelemetry auto-instrumentation agents, meaning no source code modifications are needed to begin capturing observability data.
Pre-configured Grafana dashboards for logs, traces, and metrics. Easily visualize your system, set up alerting rules, and perform real-time log analysis with intuitive queries.
Integrate with your existing identity provider using OAuth2, and manage user authentication and access control with ease.
Keep sensitive telemetry data inside your Kubernetes environment. No subscriptions or external storage are required — you retain full control over your data.
Deploy or tear down the observability stack on demand, making it ideal for testing, staging, and production environments with varying workloads.
Observability Foundry is built entirely on trusted and widely adopted open source technologies such as OpenTelemetry, Grafana, Loki, Jaeger, and Prometheus. This ensures transparency, community support, and long-term sustainability without vendor lock-in. You can audit the source code, contribute enhancements, or tailor the platform to meet specific security or compliance requirements.
Observability Foundry is designed around an OpenTelemetry-centric architecture, making it easy to integrate telemetry data from a wide range of sources. With built-in support for OpenTelemetry Instrumentation, it works seamlessly across many programming languages and frameworks, enabling effortless collection of metrics, traces, and logs. The collected data can be sent to popular backends like Prometheus, Jaeger, and OpenSearch for storage, visualization, and analysis.
Observability Foundry comes with pre-configured Grafana data sources for OpenSearch, Prometheus, and Jaeger, making it easy to get started without manual setup. Users can instantly visualize logs, metrics, and traces through ready-to-use Grafana dashboards—offering a unified view of system performance and health. Grafana alerts can also be configured to notify users of issues or anomalies, enabling proactive monitoring and faster troubleshooting.
Observability Foundry includes a pre-configured Keycloak OIDC server to provide secure authentication and authorization for Grafana and other integrated components. This setup simplifies user management and access control, ensuring that only authorized users can access or modify telemetry data. With built-in OpenID Connect (OIDC) support, Keycloak integrates seamlessly with Grafana—enhancing security while keeping the user experience simple and intuitive.